METHODOLOGY
Big data has the ability to revolutionize the humanitarian sector. Accurate and timely information has traditionally been a main constraint in disaster risk preparation and is of paramount importance to meet the Sustainable Development Goals (SDGs)
Geo spatial information can play an important role in achieving sustainable development and reducing vulnerabilities and deprivations by mapping different dimensions of vulnerability across space and time.
In this study Big Earth data were translated into indicators using the data from the Cambodia Socio-Economic Survey. The indicators were then translated into dimensions which add up an overall vulnerability.

The 17 sustainable development goals.
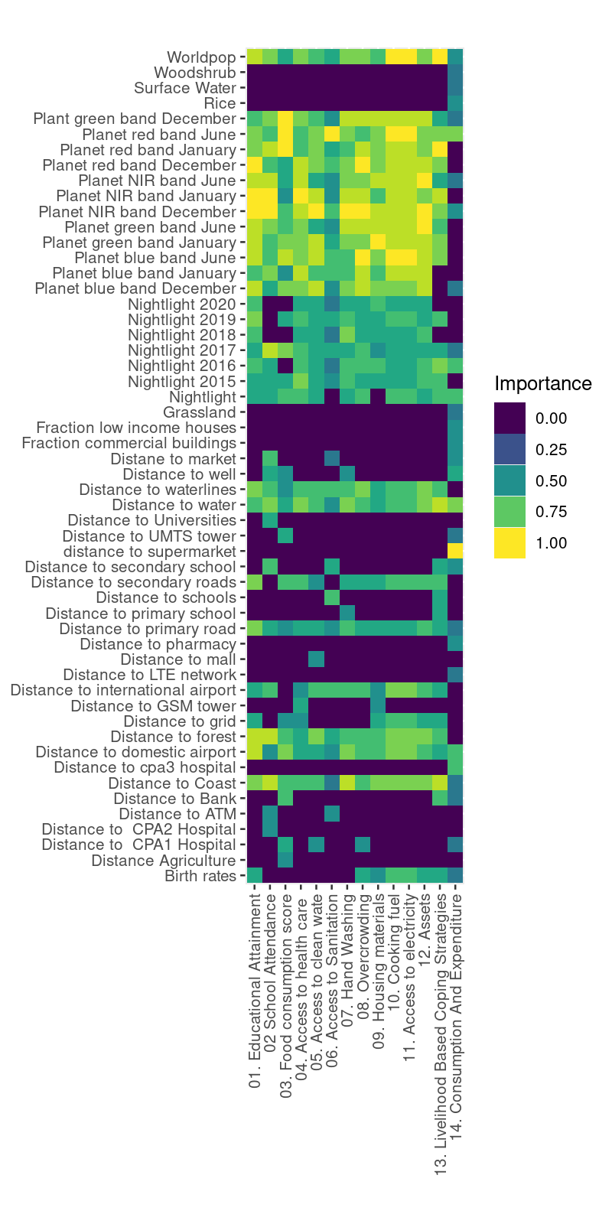
A random forest algorithm was trained with a large number of geo spatial information layers on e.g. distance to roads, electricity grid, nightlights, health facilities, schools, land cover etc and the data from the Cambodia Socio-economic survey. The random forest model was then applied in probability mode to estimate the probability of deprivations across the country on a 100 by 100 meter grid. The variable importance of the different indicators is shown in FIG 1.
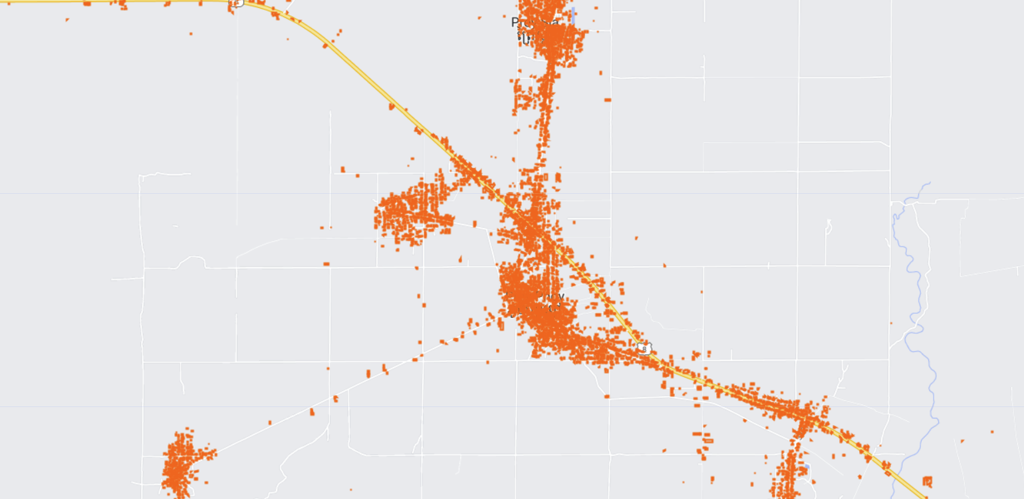
We used the Bing open building footprints dataset to calculate the deprivations per household. This dataset was generated using a machine learning approach on high resolution satellite images. It provides information on the location of buildings in Cambodia.
The image below shows the number of deprivations per household on the country level. This dataset can be explored in more detail in the map section of this website.
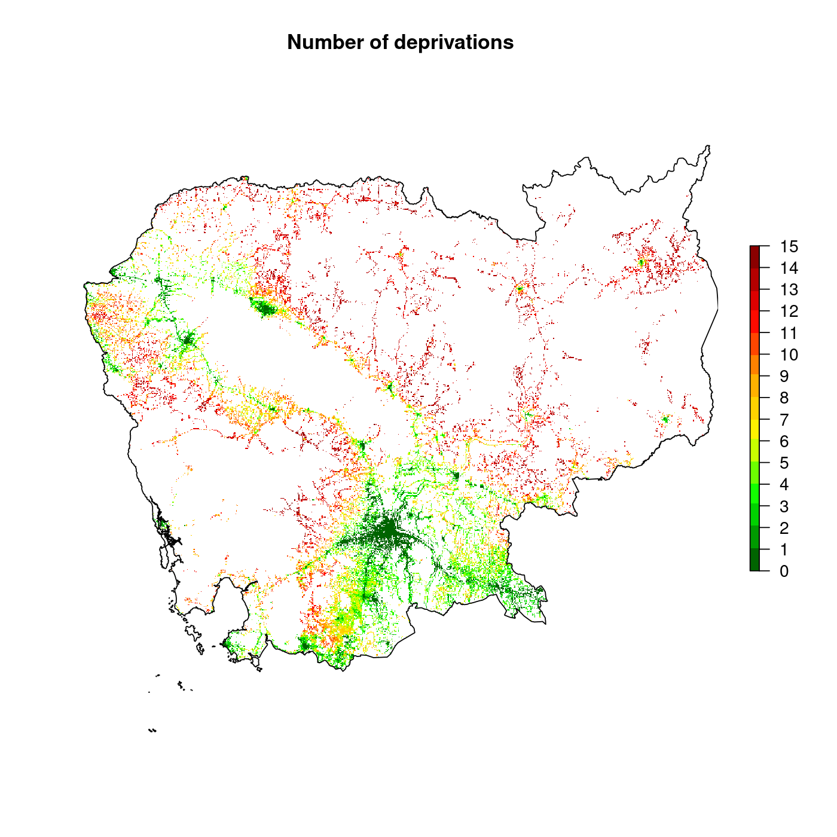
FIG. 1 The variable importance of the different indicators